The Number that Lies
OEE cannot exceed 100%. So when I found 106.4% on a packaging line, I went looking for the error. What I found instead was a system designed to limit questions rather than surface performance.

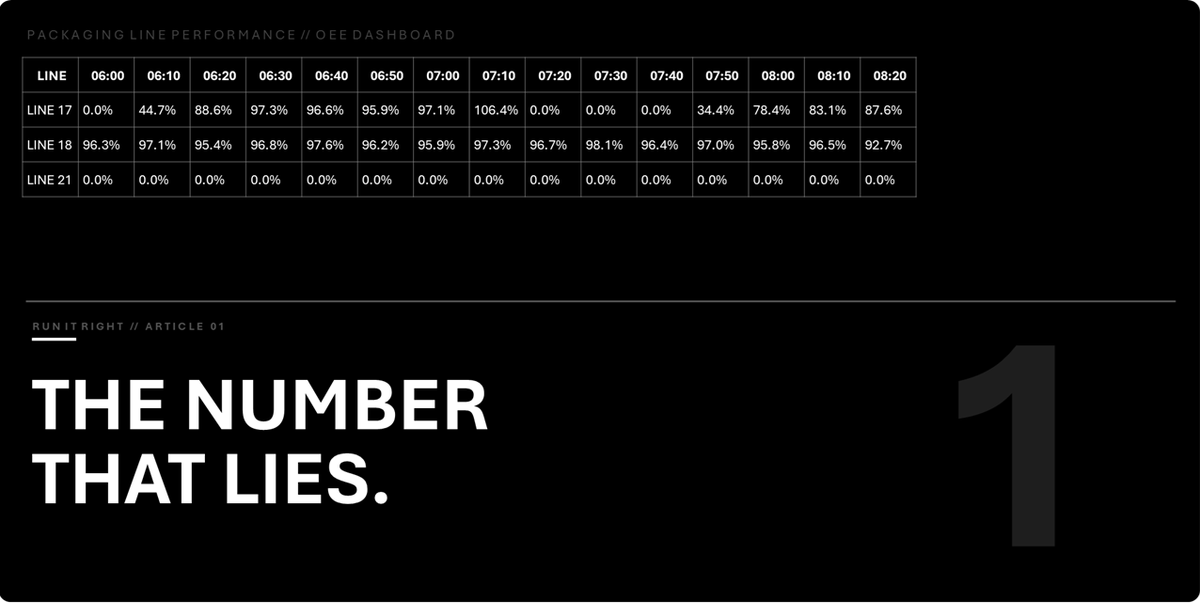
I found a 106.4% OEE on a packaging line.
I found it by accident.
My first thought was a data error. Availability, performance, quality, multiply three numbers and the result cannot exceed 100%. So when it shows 106.4%, something is wrong.
I went back into the raw data to find the error.
I found more instances instead.
On the same line, on other lines. Different products, different shifts, different weeks. The same pattern, a brief window during start up where OEE climbed above 100%, followed by a stop, followed by the line settling back into its familiar range.
This was not a data entry error, the data was automatically recorded, the pattern was structural.
My second thought was more serious. If the line had run above its validated speed, we had a quality investigation on our hands.
I checked the validated line speed, going back to the validation documents, comparing vs the actual line speed. The line had not exceeded it, it had never even come close.
So I looked at the OEE calculation in the dashboard, particularly the denominator.
OEE performance is calculated against a reference speed, the speed the line is supposed to run at. That reference speed sits in the system as the number everything else is measured against. If that number is wrong, every calculation built on top of it is wrong. Quietly wrong. Structurally wrong. In a way no one would really notice.
The reference speed in the OEE system was significantly lower than the validated line speed in the qualification document.
By enough to really matter. By enough that when the line briefly ran at or near its actual validated speed, even with the mess that is a start up on a blister and carton packing line, the OEE calculation can produce a number above 100%.
It wasn’t an error, the number had not drifted. It had been set.
Not maliciously. But deliberately. The OEE denominator had been chosen not to reflect what the line was capable of, but to produce a picture of what the line was capable of when the OEE measure was put in place, a number that management could accept. A number that looked like performance. A number that reported well.
By hiding the real denominator, we hid opportunity.
The gap between what the line was being measured against and what it was actually capable of was not a rounding error. It was recoverable performance, shift by shift, week by week, written off inside a number that everybody saw and nobody questioned.
And we had driven that behaviour.
By caring about the number and not the performance behind it. By asking what the OEE was without asking what it meant. By telling people what to report without explaining why the right denominator matters, what it represents, what it enables, what it costs when it is wrong.
When you measure the picture instead of the reality, people learn to manage the picture.
That is not a failure of integrity. It is a rational response to the incentives the system created.
I wish I could say this was the only time I had seen it.
It was not even close.
I have seen OTIF, On Time In Full, the measure that is supposed to tell you whether your customers are getting what they ordered, when they ordered it, measured from the moment a shipment left our warehouse. Not when it arrived. Not whether the customer received it on time. Whether we had dispatched it. We were measuring our own action, not the outcome it was supposed to produce. And the number looked good. The customer experience did not. But it was the easy-to-measure metric, we didn’t have access to the logistics provider’s delivery date and time so we measured what we could and called it performance.
I have seen OTIF defined as hitting 95% of the volume within five days of the delivery date and counted as a full hit. A shipment that arrived three days late, with 96% of the order, was recorded as on time and in full. The customer knew it was not. The number said it was.
I have seen volume measures reported year to date when the current period was behind, because the strong start to the year smoothed out the recent decline and kept the number inside the acceptable range. Then reported as a rolling average when the year to date had deteriorated, because the rolling window is harder to move and hides performance dips and peeks.
In every case, the people producing these numbers were not acting in bad faith. They were responding rationally to a system that asked them to report a number without asking them to be honest about what it meant. A system that rewarded the acceptable number and made the honest conversation harder than the managed one.
The measure was not designed to surface performance.
It was designed to limit questions.
I had the conversation at the line first. The operators confirmed the setting. It was in the setup book. That was the standard they worked to, and they had no reason to question it. Maintenance had been using an older version of the document. Not out of carelessness, because it was the one in his desk, one he had used forever.
At the department level the question changed. Not who had set the wrong speed, but when it had changed and why. The question on the table was simple, how many other lines had the same problem. What had started as a denominator problem was now a question about whether the standards across the site were under control.
At the leadership level it went further still. A number above 100% had led us to a conversation about document management, version control, and whether people across the site were working to current standards in areas well beyond OEE. Nobody had done anything wrong. Everyone had done exactly what the system asked of them. That was the problem.
None of those conversations were comfortable.
All of them were necessary.
Because the real problem was never the denominator, or the OTIF definition, or the choice of time period.
The real problem was a system that had made it easier to report an acceptable number than to surface an honest one.
Fix the measure without fixing that system and the same thing happens again. In a different metric. On a different line. In a different year. With a different person who is doing exactly what the system rewards them for doing.
Here is what 25 years of finding numbers like these has taught me.
The number above 100% is rare, it is a flag someone will see and question, eventually. What it represents is not.
Every organisation I have worked in has a version of this. A measure set to report rather than to drive. A target calibrated to what is achievable rather than what is possible. A definition chosen for the picture it produces rather than the reality it reflects. A time period selected to keep the question from being asked.
The number on the screen is not the problem.
The system that decided what the number should say, that is the problem.
Somewhere in your organisation right now there is a number doing the same job.
It may not be showing 106.4%.
It is probably showing something that looks entirely reasonable.
That is what makes it dangerous.
I found my first lying number by accident. The others deliberately, once I knew what to look for.
The question is not whether it exists in your organisation. The question is whether you are ready to find it, and what you will do when you do.