Problem Definition
A problem that has been solved three times and keeps coming back was never properly defined in the first place. The fix addressed the symptom. The cause remained. This guide is a step-by-step process for defining a problem precisely enough that the right fix becomes obvious, and stays fixed.
Getting to the right problem before you try to fix it
The problem you think you have is rarely the problem you have.
Most improvement efforts fail not because the solution was wrong, but because the problem was not properly defined. The team fixed what they could see. The symptom. The thing that was causing the most noise that week.
The cause was somewhere else. It almost always is.
This guide walks through the problem definition process in sequence. It is not a form to fill in. It is a discipline. A way of thinking. A way of earning the right to have an opinion about a problem before you act on it.
Work through the steps in order. The refocused problem statement at the end is only as good as the work you do before it. Once you get to the end of Step 5, think about whether you need to go back to Step 1.
- Step 1 — Write the Initial Problem Statement
- State what you know now, before you investigate
- Step 2 — Stratify the Data
- Narrow the picture before you go to observe
- Step 3 — Go and See
- Observe, sketch, interview, and gather what you need
- Step 4 — Understand the Problem
- Ask the questions that earn the right to act
- Step 5 — Write the Refocused Problem Statement
- State what you now know to be true
Do not skip ahead. The refocused problem statement in Step 5 is only useful if it looks different from the one you wrote in Step 1. If it looks the same, you have not looked hard enough.
Step 1 — Write the Initial Problem Statement
Before you look at any data, before you go to the line, write down what you think the problem is. In plain language. One or two sentences.
This is not a diagnosis. It is not a cause. It is a description of the problem as you understand it now.
It does not need to be precise yet. It will not be. That is the point. You are writing down your starting assumption so that you can test it.
Write it down. Do not refine it. Move to Step 2.
Watch out: The most common mistake at this stage is writing a cause into the problem statement. "The machine is running too fast" is a cause. "Output is falling below target on Line 4 during the afternoon shift" is a problem statement. Keep them separate.
At the end of this step you have your Initial Problem Statement
Step 2 — Stratify the Data
Before you go to observe, use the data you already have to narrow the picture. The purpose is not to solve the problem from a distance. It is to eliminate what you can eliminate so that when you are standing at the line, you are looking for something specific rather than everything at once.
The questions below are the same ones you will use in Step 4. The difference is that here you are answering them with data rather than direct observation. Some you will be able to answer now. Others will remain open until you go to see. Both outcomes are useful.
- WHO
- Does the problem follow a specific operator, crew, or team?
- Are there differences in how often different teams find it?
- Does it happen regardless of who is running the line?
- WHAT
- Is the problem consistent in how it presents, or does it vary?
- Does it always look the same, or are there different failure modes appearing under different conditions?
- WHERE
- Is the problem specific to one line, one machine, one section of the process?
- If the same product runs on multiple lines, does the problem appear on all of them or only some?
- WHEN
- Does the problem occur at a specific point in the shift, start-up, mid-shift, end of shift?
- Does it appear after a changeover, after a planned stop, after a maintenance intervention?
- Is there a pattern by day of week, time of month, or season?
- Is it getting worse, improving, or staying consistent over time?
- WHICH
- Is the problem specific to one product, format, or SKU, or one piece of equipment?
- Does it affect everything that runs through, or only certain variants?
- Which are most affected, and which are not affected at all?
- TO WHOM
- Who or what is downstream of this problem?
- Who is reporting it, and who is absorbing the consequence?
- What happens if it is not caught immediately?
- HOW
- Can you describe the sequence of events that leads to the problem from the data alone?
- What does the record show about how it unfolds?
- HOW MUCH
- How often is it occurring?
- How many units, how much time, how much cost?
- Over what period do the records go back, and is the rate consistent across that period?
- Why did the business select this problem to investigate?
There are many tools will help you answer these questions from the data before you go to observe. Below are three that I find most commonly useful at this stage. They are intended to be used in combination, not in isolation.
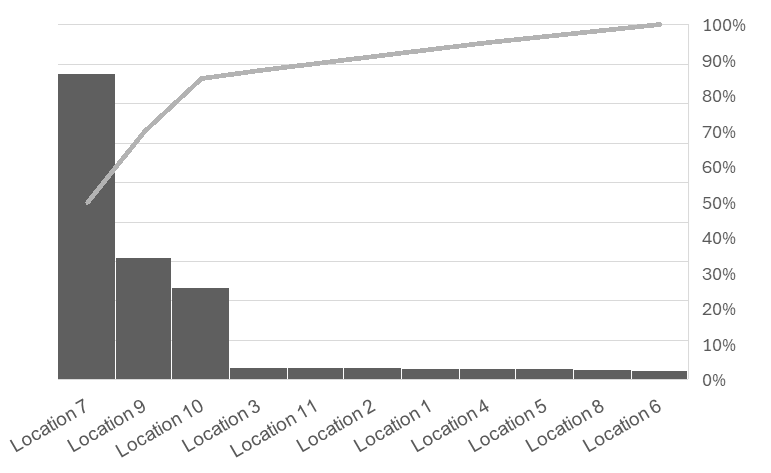
Pareto chart: Rank the categories of loss by size: by line, by format, by failure mode, by shift, by area. A Pareto will quickly show you where the majority of the problem is concentrated. In most cases, a small number of categories will account for most of the loss. That is where you go first. It answers WHERE, WHICH, and WHO.
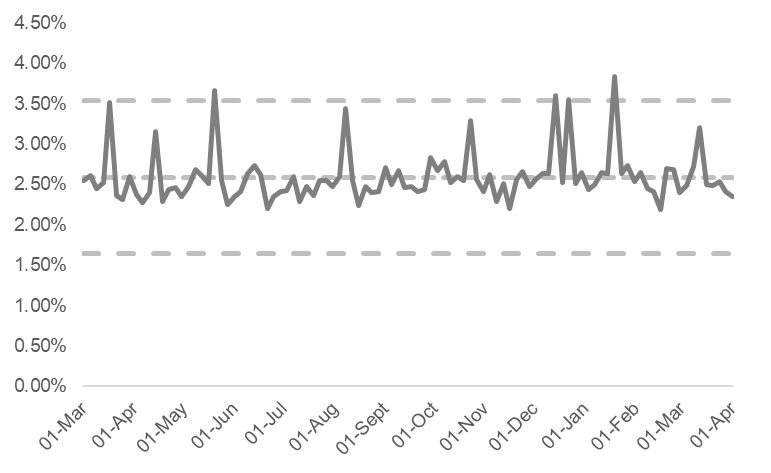
Trend Line / Time Series Plot: Plot the problem over time. Is the rate stable, getting worse, or improving? A stable rate tells you the problem is structural — it has been there long enough to become normal. A worsening trend tells you something has changed. An improving trend tells you something is already working, even if nobody has named it yet. It answers WHEN and HOW MUCH.
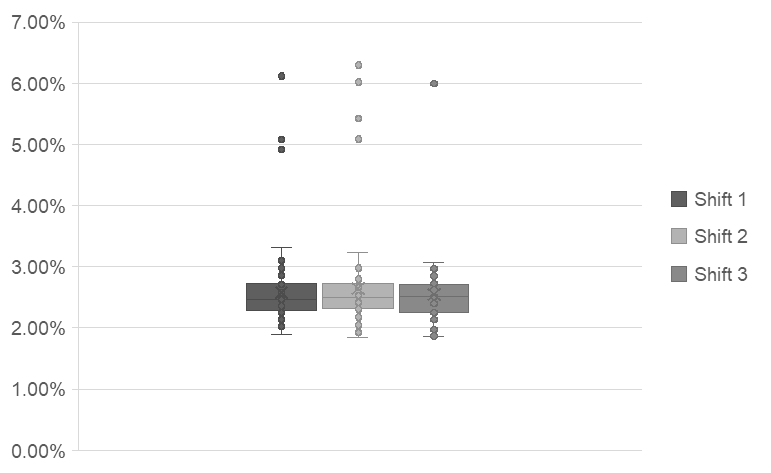
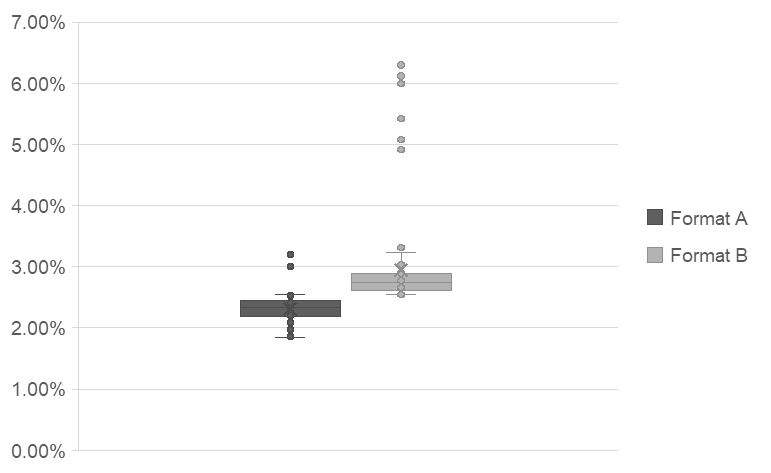
Box plot: Plot the spread of the problem across a variable: shift by shift, crew by crew, format by format, day by day. The average tells you the size of the problem. The spread tells you how consistent it is. A wide spread on one variable, one shift with a much larger range than the others, for example, is pointing at something. A consistent spread across all variables means the cause is not in any of them. It answers WHO, WHEN, and WHICH.
By the end of this step you should be able to say what the problem is not — not a shift problem, not a crew problem, not seasonal — as clearly as you can say what it might be. Absence of a pattern is information. It narrows the search just as much as finding one does.
At the end of this step you have a stratified picture of what you know and what you do not.
- WHO: No clear pattern by operator or shift team
- WHAT: Waste appears as product WIP in the scrap bin
- WHERE: Majority of the waste is concentrated in bin 7
- WHEN: No clear seasonal pattern, some increase in the 6 hours preceding a SKU format change
- WHICH: Taller format significantly more affected than shorter formats
- TO WHOM: Accounts for over 20% of total line waste, operators required to empty bins multiple times a shift.
- HOW: No clear data
- HOW MUCH: Consistent rate over at least two years of records. Selected because it is the largest single waste category on the line. $xxx,xxx impact per year
At the end of this step you have your Updated Problem Statement
Step 3 — Go and See
You cannot define a problem properly from a desk. At some point you have to go to the place where it is happening and watch. This step has four parts. Work through them in order.
Observe
Watch the process run. Do not touch anything yet. When the problem occurs, note exactly how it happened, in what sequence, and under what conditions. Note also when it does not happen, the conditions under which the process runs without the problem are as informative as the conditions under which it fails.
Trace the problem upstream. The place where it becomes visible is rarely the place where it is happening.
Sketch
Draw the area. Not a diagram, a sketch. Show the equipment layout, the material flow, where people are positioned, and what they are doing. Follow the thing: trace the path of the product, the part, or the material through the area and mark where the problem occurs on your sketch.
A sketch forces you to look at the whole system, not just the point of failure. It captures geometry, flow, and relationships that a photograph cannot. It does not need to be neat. It needs to be accurate enough to show what is happening and where.
Interview
Talk to the person who found the problem and the person who runs the process every day. They are not always the same person. Ask what they see, what they have tried, and what they think is causing it. They have been watching this longer than you have.
Listen carefully to what they say the problem is not. Experienced operators have usually already eliminated several causes through their own observation. That knowledge is part of your investigation.
Gather additional documentation
Now that you have narrowed the problem sufficiently, you know the location, the conditions, and the population affected, pull the relevant records. Existing standards and specifications for this area. Prior attempts to fix this problem and what happened. Maintenance records, quality databases, and engineering documentation specific to this location and this failure mode.
This step prevents the team from rediscovering a fix that was already tried and failed. It also tells you whether the current standard is correct, missing, or not being followed, which is often part of the answer.
At the end of Step 3 you have located the problem. Waste is not occurring at the bin. It is occurring at the transfer point upstream. The bin is where it becomes visible. You have watched it happen, sketched the area and the forces involved, spoken to the operator who has been clearing that bin for two years, and reviewed the maintenance records for that section. You are ready to work through Step 4.
At the end of this step you have your Updated Problem Statement.
Step 4 — Understand the Problem
Structured problem definition is built around asking simple questions to better understand what you are observing. Each question has a purpose. Together they build a complete description of the problem, one that is specific enough to point directly at a cause.
Answer each one at the place where the problem is happening, with the people who know it best. Not at a desk. Not from a report.
- WHO
- Who is affected by this problem?
- Who first notices it?
- Who has to respond to it?
- Has any team or person found it at a much lower frequency than others?
- WHAT
- What exactly is happening? Describe it precisely, what object, what action, what failure mode?
- What should you see that you do not?
- Is there damage or wear on the product, the machine, or the parts involved?
- WHERE
- Where exactly is it happening?
- Which line, which section, which specific point in the process?
- Follow the phenomenon back from where you find it to where you stop seeing it, take small steps, narrow the location precisely.
- WHEN
- When does it happen?
- At what point in the shift, the cycle, the batch?
- Under what operating conditions?
- Does the failure mode always look the same, or does it vary?
- WHICH
- Which variants, formats, products, SKUs, or equipment are affected?
- Which are not?
- TO WHOM
- Who or what does this problem affect downstream?
- What is the consequence for the next step, the next team, the customer?
- What happens if it is not caught immediately?
- HOW
- What is happening just before the failure occurs that is different from normal operation?
- Describe the sequence of events that leads from normal to failure.
- HOW MUCH
- How often does it happen?
- How many units, how much time, how much cost?
- Is it one-off or chronic?
- Over what period?
At the end of Step 4 you have answers to the questions above, enough to be able to understand how this phenomenon is occurring and a complete description of the problem as observed
Step 5 — Write the Refocused Problem Statement
You now have enough to write a better problem statement, one that is worth acting on.
A good refocused problem statement:
- Names the specific object and failure mode
- States where it is being observed and where it is actually happening
- States when and under what conditions
- States which variants are affected and which are not
- States how long it has been happening and how often
- States the mechanism if confirmed
If your refocused problem statement looks similar to your initial one, go back to Step 1. You have not found the specific, solvable problem yet.
Initial Problem Statement
At the end of this step you have your Final Problem Statement
What This Gives You
By the end of Step 5 you have two things.
When to go around again
The process is not always linear. Sometimes the refocused problem statement at the end of Step 5 is not the answer. It is a better question.
If your investigation has narrowed the problem significantly but has not yet confirmed the mechanism, take your Step 5 output and make it your new Step 1. Run the process again, at higher resolution, on the smaller problem.
You will know it is time to go around again when:
- The refocused problem statement is more specific than the initial one, but still describes a symptom rather than a mechanism
- Step 2 eliminated several variables but left one or two open that the observation in Step 3 did not resolve
- The fix that seems obvious has been tried before and did not hold
Each pass narrows the problem. Each refocused problem statement is more specific than the one before it. You stop when the mechanism is confirmed and the fix is clear.
Common pitfalls
Key links
Problem Definition is Stage 1 of the Problem Solving process. Once the problem is defined, the investigation continues there.
Once the problem is defined, returning to standard is the next check before root cause analysis begins.